| pA2 online © Copyright 2004 The British Pharmacological Society |
117P
University of Bath Summer Meeting July 2004 |
|
Comparison of ETA and ETB receptor distribution by radioligand binding and immunocytochemistry R.E. Kuc & A.P. Davenport, Clinical Pharmacology Unit,University of Cambridge, Level 6, Centre for Clinical Investigation, Box 110, Addenbrookes Hospital, Cambridge CB2 2QQ U.K |
|
Radioligand binding and autoradiography measures the distribution of receptors (Davenport et al 2002). Binding of radioligands can be modulated by a number of processes and not all receptors may be visualised by this technique. The extracellular N-terminus of ETB receptors can be cleaved by metalloproteinases to remove the first 64 amino acids (Grantcharova et al 2002). Splice variants also exist for both sub-types (Davenport 2002). An atypical endothelin receptor has been proposed in kidney of ETB deficient rats (Taylor et al 2003). Our aim was to compare the distribution of ETA and ETB receptors visualised by selective ligands with the immunocytochemical localisation of each receptor.
Ligand binding assays were carried out as previously described: consecutive cryostat sections (10 µm) were incubated with 0.25 nM [125I]-PD151242, to visualise the ETA sub-type or 0.25 nM [125I]-BQ3020 to visualise ETB receptors for two hours at room temperature. One µM of the corresponding unlabelled peptide defined the non-specific binding in adjacent sections. Sections were apposed to radiation sensitive film (Davenport et al 2002). Immunocytochemistry was carried out using adjacent cryostat sections (30 µm). Site directed rabbit antisera were raised to the C-terminus of ETA(413-427) and ETB(428-442), the N-terminus of ETB(1-14) and to ETB (302-313). Binding of the primary antisera were visualised by the peroxidase-antiperoxidase technique.
In human kidney, ETA receptors visualised by [125I]-PD151242 and antisera to the C-terminus displayed a similar vascular distribution, localising to the smooth muscle layer of the main renal arteries, arcuate arteries and veins as well as smaller intra-renal resistance vessels (Figure 1).
ETB receptors were localised using [125I]-BQ3020 and antisera to the N-terminus or C-terminus. ETB-like immunoreactivity was detected within the endothelial cells of the renal vasculature using both antisera. There were no obvious discrepancies between ETB binding and staining in other regions of the kidney such as the medullary rays and renal tubules.
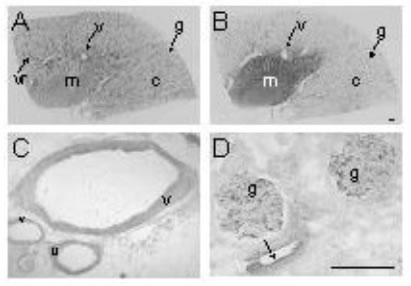
Figure 1. Representative autoradiographical images of radioligands binding to ETA receptors predominantly in the renal vasculature (A) and ETB (B) receptors mainly to tubules in human kidney. Immunocytochemical localisation of ETA receptors to (C) smooth muscle of arcuate arteries and adjacent veins. ETB receptors localised to endothelial cells of vessels (D) as well as glomeruli. (c, cortex; g, glomerulus; m, medulla; v, vessel; vr, vasa recta; arrows indicate endothelial cells). Scale bar = 200 µm.
Our results suggest no evidence, in the tissues examined, for a differential distribution in receptors for either sub-type visualised by the two techniques that might have indicated modified receptors or further sub-types in human kidney. These results agree with our previous molecular studies (Karet et al 1996).
Davenport, AP. (2002). Pharmacol Rev; 54:219-26
Davenport AP, Kuc RE. (2002). Methods Mol Biol; 206:45-70
Grantcharova E, et al. (2002).J Biol Chem; 277:43933-41
Karet FE, Davenport AP. (1996). Nephrol Dial Transplant; 11:1976-82
Taylor TA, et al. (2003) Am J Physiol Regul Integr Comp Physiol; 284:R674-81