
Print version
Search Pub Med

Positron emission tomography (PET) is widely used to study biological processes in vivo and is the most sensitive technique to image and quantify receptors in living animals (Johnstrom et al, 2005, 2010). However, PET tracer uptake does not usually provide sufficiently detailed anatomical structure to accurately allocate receptor activity to precise tissue regions. This limitation is particularly important for studying genetically transformed mice but may be overcome by simultaneous imaging with PET and MRI. The aim of the study was to evaluate the combined PET/MRI scanner for the investigation of biological processes in rodents. Dynamic in vivo imaging was carried out using a modified Focus F120 microPET (Siemens AG, Germany) incorporated into a bespoke 1 Tesla MR magnet (Magnex Scientific), U.K.) (Hawkes et al, 2010) for up to 4 h. The MR scanner has a split magnet allowing the positioning of the PET detectors in their standard geometry for the F120, and maintains the full field of view of the F120. The split also allows the use of conventional photo-multiplier tubes as they are positioned in a region of low magnetic field through the use of long light-guides. The MR scanner is controlled by an Advance 3 MRI console (Bruker Biospin). A computer controlled animal bed (Automatic Positioning System, Bruker Biospin) enables precise positioning of the animal at the centre of both modalities. Adult mice (males and females, C57BL/6J, age ∼42 weeks, n = 3) were anaesthetised with 3% isofluorane vaporised in O2 and maintained with 1 – 1.5% isofluorane. Mice were placed prone in a purpose-built combined bed and MRI RF coil structure. The computer controlled scanning bed was positioned so that the axial field of view (∼4 cm for MRI) centred on the thorax. Body temperature, ECG and respiration were monitored and maintained in the normal range. A tail vein was cannulated for administration of ∼30 MBq [18F]-FEDAA 1106 (N-(5-fluoro-2-phenoxyphenyl)-N-(2-[18F]-fluoroethyloxy-5-methoxybenzyl)acetamide, typical specific activity, 948GBq/µmol; typical mass, 0.15nmols). The PET image resolution was ∼1.4mm) and MRI resolution was isotropic 0.35 mm. 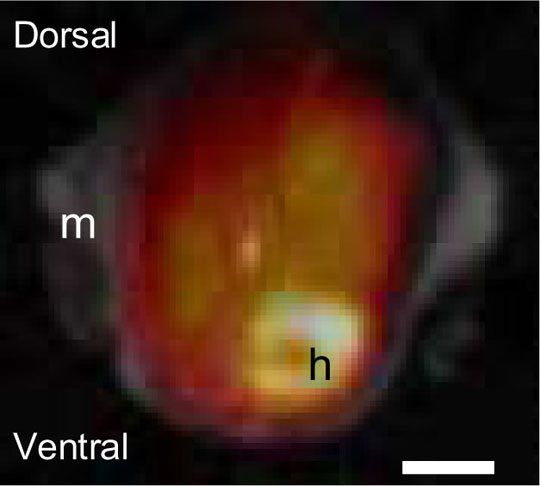
Figure 1. Combined PET/MRI image obtained simultaneously of a transverse plane of a mouse showing the distribution of [18F]-FEDAA to the heart (h) and lungs with musculature (m) visualised by MRI. Scale bar = 5 mm. PET data were collected for up to 4 hours in list mode with microPET manager and PET images were reconstructed using filtered back projection as implemented in the supplied software package (ASIPro Siemens). Respiration-gated MRI images were reconstructed and aligned with MATLAB (The MathWorks, Inc, USA) and Statistical Parametric Mapping software. Combined PET/MRI images (Fig. 1) and time activity curves delineated by the MR images, revealed rapid redistribution from the vascular compartment within 4 min, with highest uptake of [18F]-FEDAA as expected into the heart, followed by lungs, liver and kidneys with lower but detectable levels within the brain. The results show that the fused anatomical-functional image not only provides anatomical context to the PET data, but can also allow improved quantification by more accurately defining the region of radioactive emission. Hawkes RC, Fryer TD, Siegel S, Ansorge RE, Carpenter TA. Preliminary evaluation of a combined microPET-MR system. Technol Cancer Res Treat. 2010 Feb;9(1):53-60. Johnström, P., Fryer, T.D., Richard, H.K., Barret, O. and Davenport, A.P. (2005) Dynamic in vivo imaging of receptors in small animals using positron emission tomography. Davenport, A.P. (Ed), In Receptor Binding Techniques. Humana Press, New Jersey, 217-31. Johnström P, Fryer TD, Richards HK, Clark JC, Pickard JD, Davenport, AP (2010). Positron emission tomography of [18F]-big endothelin-1 reveals renal excretion but tissue specific conversion to [18F]- endothelin-1 in lung and liver. British Journal of Pharmacology 159, 812-819. We thank British Heart Foundation for support.
|
|