Mining Multi-dimensional Pharmacological Data, with Principal Component Analysis To progress from Hit Identification to the Candidate Selection phase of a NCE project, a vast amount of experimental data is generated in search of a suitable molecule. Effective profiling to optimise the in vitro pharmacology, ADME and Physical Chemical properties requires interpretation of the often complex relationships between disparate assays in large data sets, with the aim of conferring in vivo efficacy to the final candidate. Principal Component Analysis (PCA) is a form of multivariate data analysis that reduces the dimensionality of data sets. A compound may be screened in ten assays, each of which reports three unique parameters, can the analytical ‘fingerprint’ from the thirty variables be reliably described with just two or three variables. If so, what level of accuracy does such a summary provide? We will focus on the use of PCA in the optimisation and understanding of screening cascades, its use in the reduction of complexity allowing identification of molecules with distinct profiles, and applications in probing structure/function relationships. Example PCA analysis will be shown from a drug discovery project, undertaken at UCB. Loading plots, highlighting areas of high and low correlation between assays in a screening cascade, will be shown. Such plots can inform on the design of the cascade and the potential significance of an atypical result in a particular assay. 
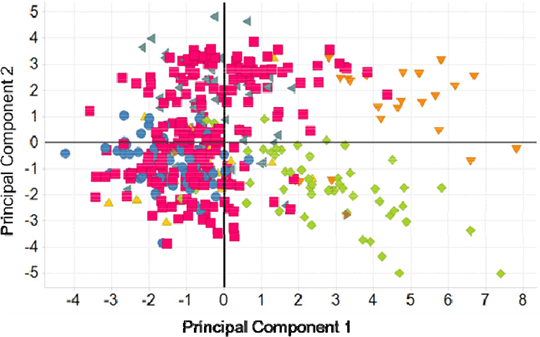
Figure 1. Clustering of Chemical Inhibitors on a Score Plot, on a PCA of in vitro data. Coloured by Chemical Series. Score Plots will be shown from a PCA analysis on an in vitro data set composed of binding, kinetic and functional assay data. A biological fingerprint for each Chemical Series is observed (Figure 1). In addition, PCA will be performed on chemical descriptors to summarise the structural and spatial uniqueness of different inhibitors. With the intention of exploring relationships between chemical structure and biological function.
|


