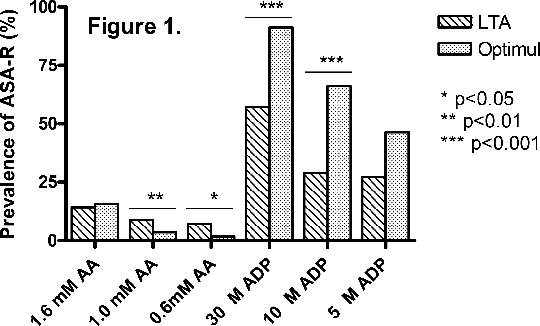
Comparison of the Optimul assay with light transmission aggregometry and whole blood aggregometry for the identification of aspirin resistance in patients with stable coronary artery disease Introduction: Platelet function tests can be used to assess a patient’s response to aspirin therapy, with light transmission aggregometry (LTA) the ‘gold standard’ for the identification of aspirin resistance (ASA-R). The 96-well plate assay (Optimul) is based on LTA, requires less technical expertise and facilitates testing of multiple agonists simultaneously. The purpose of this study was to compare Optimul to LTA and whole blood aggregometry (WBA) for the detection of ASA-R. Methods: Whole blood was drawn into citrate (final concentration 0.32%) from patients with coronary artery disease receiving 75mg aspirin daily (n=56). Platelet-rich plasma was tested by LTA and Optimul in response to arachidonic acid (AA 0.6-1.6mM) and adenosine diphosphate (ADP 5-30µM), and by WBA in response to 1.0mM AA. ASA-R was defined as ≥20% aggregation in response to AA, ≥70% aggregation in response to ADP and an impedance ≥3Ω by WBA. Inter-assay agreement of ASA-R status (defined by LTA 1.6mM AA) was assessed by Fleiss’ Kappa. Spearman’s correlation and paired t-test were used to compare aggregation observed by Optimul and LTA. Results: The prevalence of ASA-R was 14.3% as assessed by LTA 1.6mM AA and 33.9% by WBA. ASA-R prevalence as assessed in response to other concentrations of AA and to ADP is shown in Figure 1. For both AA and ADP, higher agonist concentrations led to an apparent increased prevalence of ASA-R. Only LTA 0.6 and 1.0mM AA agreed with LTA 1.6mM AA for the identification of ASA-R (κ=0.45, 95%CI 0.09-0.81; κ=0.74, 95%CI 0.47-1.12 respectively). Optimul correlated significantly with LTA for 0.6 and 1.0mM AA (r=0.40, r=0.38; both p<0.01), and for 5, 10 and 30µM ADP (r=0.73, r=0.31, r=0.30; all p<0.05). A non-significant correlation was observed for 1.6mM AA (r=0.23, p=0.08). The observed aggregation by Optimul was significantly lower compared to LTA for 0.6 and 1.0mM AA (both p<0.05), but not for 1.6mM AA. The opposite was seen with ADP, with increased aggregation by Optimul in response to 10 and 30µM (both p<0.01), but not for 5µM ADP. Conclusions: There is poor inter-assay agreement on the prevalence of ASA-R by LTA, WBA and Optimul. Results from LTA and Optimul generally correlate significantly, but with enhanced ADP aggregation and attenuated AA aggregation by Optimul. This is consistent with previous observations that LTA is more driven by thromboxane A2 (TXA2) than Optimul, which appears more ADP dependent. Using LTA-validated aggregation definitions for ASA-R is therefore inappropriate with Optimul, and further work needs to be done to define ASA-R accurately using this assay. 
|


