Using Non-Linear Mixed Effects Modelling to Explore the Pharmacology of 5-HT3 Receptors
Introduction: Variability between experiments can present a challenge when investigating drug mechanisms. Data normalisation is often used to simplify analysis, presentation and interpretation. However, normalisation can obscure quantitative and biological relationships and generate misleading conclusions. In this study we employed non-linear mixed effects modelling to analyse electrophysiological data and compared the results with a conventional analysis of normalised data. Methods: We measured the inhibitory effect of citral on 5-HT-induced currents in Xenopus oocytes expressing 5-HT3 receptors usingtwo-electrode voltage clamp. Concentration-response and concentration-inhibition data were obtained for 5-HT alone and 5-HT with citral, yielding 532 data points from 55 oocytes. Data were analysed(1) in a single global model using the population PK-PD modelling software NONMEM 7.3.0® (Icon PLC), and(2) following normalisation of responses to the maximal peak current amplitude for each oocyte. The structural model for the agonist action of 5-HT was a three parameter logistic equation (parameters: maximum peak current response; pEC50; Hill coefficient). Other parameters defined the effect of the inhibitor on the 5-HT agonist parameters (including pIC50) and could accommodate and model competitive, pseudo-competitive (i.e., EC50 shift with Schild Plot slope ≠ 1), non-competitive and mixed patterns of inhibition.
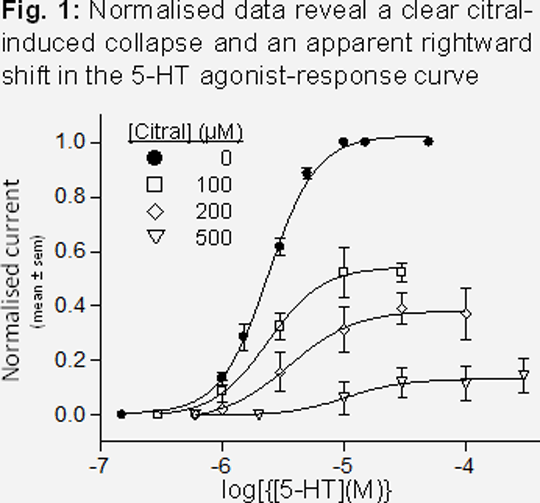
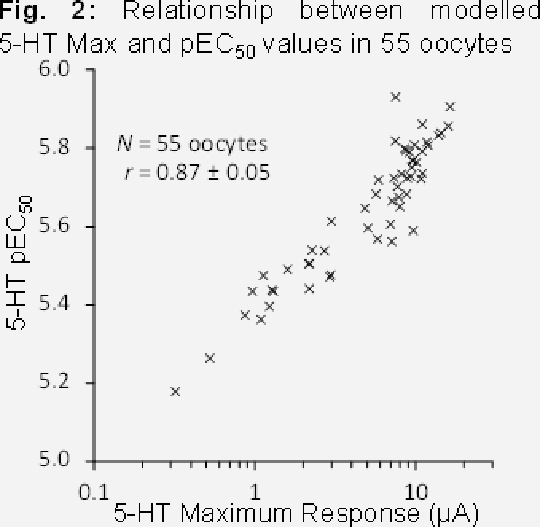
Results: Both analyses showed that citralinhibited the 5-HT response. Specifically, there was a concentration-dependent collapse in the maximum response to 5-HT, suggesting a non-competitive mechanism of action (pIC50 = 3.92 ± 0.05 (NONMEM)or 4.01 ± 0.04 (normalised)). However, normalisation of the data (Fig. 1) indicated that citral also caused a rightwardshift in the 5-HT agonist-response curve. By contrast, the NONMEM analysis found no evidence of any change in the pEC50 (P = 0.94, likelihood ratio test). However, itdid reveala strong correlation between the 5-HT maximal response and pEC50values for individual oocytes (Fig. 2, correlation coefficient = 0.87 ± 0.05 (P = 4 × 10⁻⁹)). Conclusions: Data normalisation can result in misleading conclusions about drug mechanisms by obscuring other pharmacologically relevant relationships. Here, the mis-representation of a shift in the 5-HT EC50 was most likely caused by variability in the maximum peak current responses of different oocytes (lowest value = 0.32µA; highest value = 16.4µA). The strong correlation between agonist EC50 and maximum peak current response is not consistent with a simple model for agonist action. We are currently exploring hypotheses that may provide a mechanistic explanation for this phenomenon.
|