Using Non-Linear-Mixed Effects Modelling to Analyse Platelet Aggregation
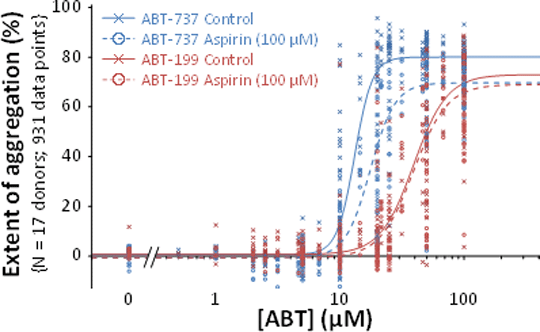
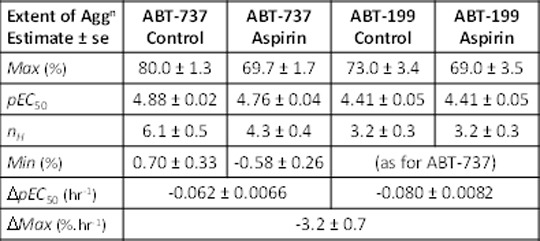
Introduction: Plateletaggregometry is widely used to investigate drug effects on platelets. However, several features of platelet aggregation can result in unreliable estimates of drug action: (a) the Hill coefficient is often high,reflecting a largely all-or-none response; (b) platelet responses show substantial heteroscedasticity; (c) responsiveness of freshly prepared platelets changes within experiments; (d) inter-individual variability (IIV) and inter-occasion variability (IOV) can complicate the analysis of pooled data from different donors and experiments. These features can make it difficult to reliably confirm or reject small drug effects. Non-Linear Mixed Effects Modelling is usedfor population PK-PD analysis and is well-suited to model and quantify these effects. In this study, aggregation responses to two BH-3 mimetic anti-cancer drugs and the effects of aspirin were analysed using Non-Linear Mixed Effects Modelling. Methods: Washed platelets (2×10⁸ml-1) were freshly prepared from citrated blood from healthy human volunteers. The extent of platelet aggregation 6 min after addition of ABT-737(1)or ABT-199 (2) was recorded with two turbidimetric AggRAM(Helena Biosciences) aggregometers. The effect of aspirin (100 µM) was also measured. Data were modelled using NONMEM 7.3.0®(Icon PLC). Concentration-response data were fitted to a four parameter logistic equation (3) which estimated maximum (Max) and minimum (Min) responses, pEC50 and the Hill coefficient (nH). The model included parameters for both agonists in the presence and absence of aspirin, and parameters that defined intra-experiment time-dependent changes in pEC50 and Max values. Residual error variance was modelled as a function of the predicted response. Variability between different donors (IIV) was modelled as a random effect on selected parameters of the model. Statistical hypotheses of nested models were evaluated using likelihood ratio tests (LRT) with degrees of freedom(df) equal to the number of constrained parameters. Results: The figure shows the raw datapoints and the fitted models. Parameter estimates and errors are shown in the table. Substantial variance is evident and was due to several factors. IIV(SD±SE) of Max(%) was 3.2±1.0for all conditions. IIV for pEC50 for ABT-199 was 0.16±0.026 and for ABT-737 was 0.09±0.017. There was also a time-dependent reduction in pEC50 and Max(see table). Aspirin had no effect on ABT-199 (P=0.59, df=3) but for ABT-737, alteredMax (P=3.3×10⁻⁷, df=1), pEC50 (P=0.0076, df=1) and nH (P=0.0028, df=1). With aspirin, Max for ABT-737 and ABT-199 were the same (P=0.87, df=1) but pEC50s differed (P=2.8×10⁻⁶). Conclusions: Non-linear mixed effects modelling can provide more detailed and informative conclusions from platelet aggregation data and address common problems that introduce variability into the data. This enables small effects to be more reliably identified and quantified and can reduce the artefactual identification of drug effects that result from not accounting for systematic or random effects in experimental design and analysis.
References: 1. Oltersdorf T et al. (2005) Nature 435: 677-681; 2. Souers AJ et al. (2013) Nat Med 19: 202-208; 3. Jarvis GE et al. (2003) Br J Pharmacol 138: 574-583.
|


