Power analysis of animal models of inflammation – carageenan paw oedema, a tool for the 3Rs
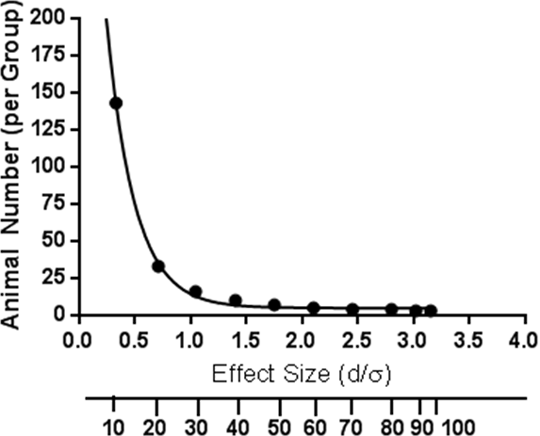
The use of animals in research has been a crucial aspect of modern scientific and drug discovery. The need for animals is magnified with the need to investigate integrative mechanisms. 3Rs: reduction, refinement & replacement are core to the European Union Animal Welfare Directive 2010/63/EU as incorporated into the Animal (Scientific Procedures) Act, 1986. Following the publication of guidelines on the welfare of rodents in models of rheumatoid arthritis (Hawkins et al, 2015), it was pointed out that reduction in numbers alone as an end could result in increased numbers of animals used through inadequate power. In addition, repeated pilot trials in individual laboratories in themselves would substantially increase the overall welfare burden unnecessarily. A time course with multiple groups of fixed effects factorial design for main effects and interactions was chosen from archive material. Male balb/c mice (n=5 per group, control, 4 drug groups, and dexamethasone positive control (0.01mg/kg p.o.) were injected sub-plantar with 0.1mL 1% carageenan. and hind paw swellingwas blindly assessed by plethysmography (Ugo Basil). Data was expressed as carageenan paw minus control paw mean±SD. Power was assessed using G*Power (Faul et al., 2007) and was calculated for the 24 hour time point. Group SD was taken to be the (control mean – lowest mean)/SQRT mean square error. Results were control: 8.4±2.9, group 1: 6.4±3.6; group 2: 4.8±1.8; Group 3: 5.2±1.6; group 4: 5.8±3.2; Dex 2.6±1.7 p<0.01 (1-way ANOVA, post hoc Dunnett’s test). Effect size: 2.46, power 0.825. Sample size per group to achieve power 0.8, was calculated as n=4, a saving of 5 mice. Taking the control and dexamethasone groups for comparison as using t-test, at the 95% significance level, the effect size (d/σ)/ % inhibition vs number of animals per group can be used to determine the numbers of animals per group required as a function of the degree of discrimination required. In order for a significant effect to be seen at 50% for example, 7 mice per group would be required (see Figure 1).
Figure 1. Effect size/% inhibition for 95% significance by t-test vs. animal numbers for mouse carageenan paw oedema. n=3 for >90% inhibition; n=4 >70%; n=5 >60%; n=7 >50%, n=10 >40%;n=16 >30%; n=33 >20%; n=143 >10%. In order for the treatments in this study to be statistically significant, groups of n=16 would be required. The sharing, and publication of archive data for power analysis can be used to reduce the number of animals Faul et al., (2007) Behaviour Res. Methods 39:175-191
|


