

| 030P London, UK Pharmacology 2016 |
Predicting in vivo pharmacokinetic drug-drug interactions due to time-dependent inhibition of cytochrome P450s using a novel numerical method
Introduction: Time-dependent inhibition (TDI) represents a severe form of cytochrome-P450 inhibition because inactivated enzymes need to be regenerated by de novo synthesis to restore their activity. Hence drug-drug interactions (DDI) due to TDI are difficult to evaluate. Current in-vitro-in-vivo correlation (IVIVC) methods lead to overprediction of TDI based DDI. The goal of this project is to better estimate TDI parameters using a novel ‘numerical method’1 and predict in-vivo DDI2.
Methods: Multiple-dose pharmacokinetic (PK) studies were performed with TDI-inactivators in Sprague-Dawley rats. Inactivator blood concentrations were measured. Further, DDI PK studies were conducted with the following TDI inactivator-substrate pairs: podophyllotoxin (PPT,I.V.,1mg/Kg,thrice every 2 hours)-midazolam (MDZ,I.V.,5mg/Kg,once), erythromycin (ERY,I.V.,100mg/Kg,twice every 2 hours)-MDZ, verapamil (VER,I.V.,5mg/Kg,thrice every 2 hours)-MDZ, norverapamil (NV,I.V.,5 mg/Kg,thrice every 2 hours)-MDZ, diltiazem (DTZ,I.V.,5mg/Kg,thrice every 2 hours)-MDZ, paroxetine (PAR,I.V.,5mg/Kg twice every 4 hours)-desipramine (DES,I.V.,5mg/Kg,once) and PAR-dextromethorphan (DXT,I.V.,10mg/Kg,once). Inactivator groups were administered the inactivator (control group was administered vehicle) with subsequent administration of the substrate. Blood samples were analyzed for substrate concentration by LC-MS/MS. The area under the curve (AUC (0-∞)) of the concentration-time (C-t) curve of the substrate was calculated both in the presence (AUCi) and absence (AUC) of inactivator for each pair. Equilibrium dialysis was performed to determine unbound fractions in plasma (fu,p). In-vitro experiments for the pairs mentioned above are currently underway using rat liver microsomes which will be analyzed by the numerical method for estimation of TDI parameters (KI and kinact).
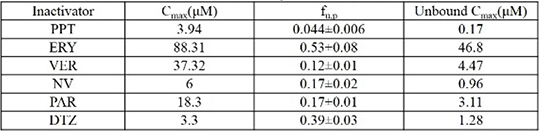
Results: Inactivators decreased the substrate clearance resulting in AUC ratio >1.25(Table1). Cmax inactivator concentrations and fup are shown in Table2.
Conclusions: The AUCi/AUC ratios >1.25 and the lower clearance in the inactivator treated groups indicate that inactivators have TDI effect in-vivo which can lead to DDI. Ongoing in-vitro studies will be used for IVIVC with these results for improved TDI prediction.

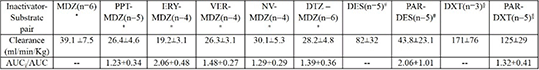
Table 2: Plasma Cmax and fu,p of the inactivators
References:
1. Nagar S. et al. (2014). Drug metabolism and disposition,42:1575-1586.
2. Barnaba C. et al. (2016). Molecular Pharmaceutics,13:2833-2843.